Figma Chart
Figma Chart
Preview
Figma Chart
Figma Chart Component
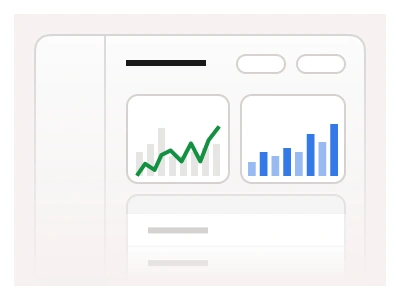
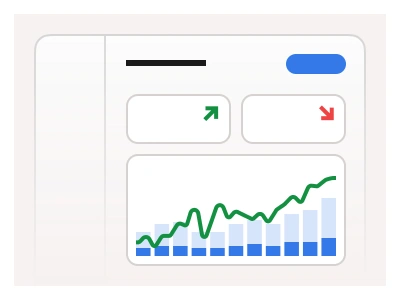
Responsive components for data visualization. Transform complex data and infographics into clear visualizations using our customizable Chart component. Our charts builder includes helpful elements like legends, gridlines, and titles to create beautiful and readable charts.
Available Chart Types
Chart Anatomy
| Set | Variants | Properties |
|---|---|---|
| ChartLegend | 21 | Size Large, Medium, SmallItems x7, x6, x5, x4, x3, x2, x1 |
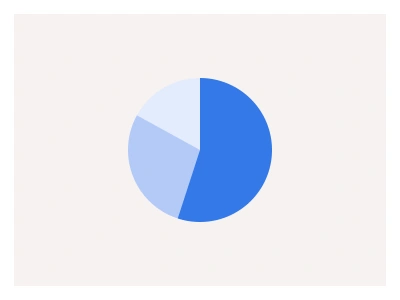
| ChartPie | 14 | Type Default, Semi CircularSegment x8, x7, x6, x5, x4, x3, x2 |
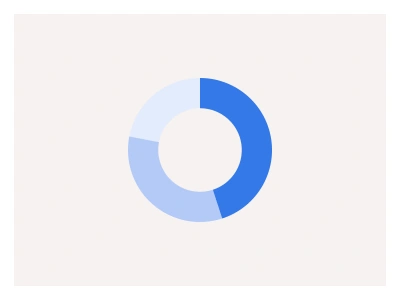
| ChartDonut | 14 | Type Default, Semi CircularSegment x8, x7, x6, x5, x4, x3, x2 |
| ChartValues | 12 | Type Horizontal, VerticalSize Small, Medium, LargeTrend Uptrends, Downtrends |
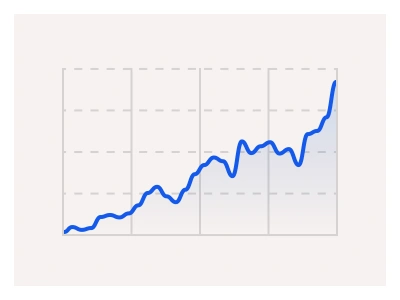
| СhartCurved | 12 | Points x10, x15, x30, x45Trend Uptrends, Sideways, Downtrends |
| СhartSharp | 12 | Points x10, x15, x30, x45Trend Uptrends, Sideways, Downtrends |
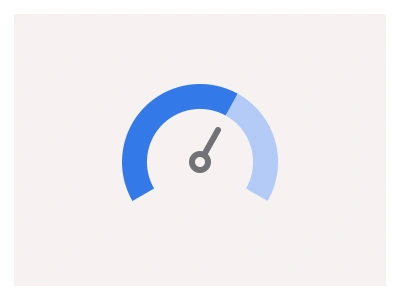
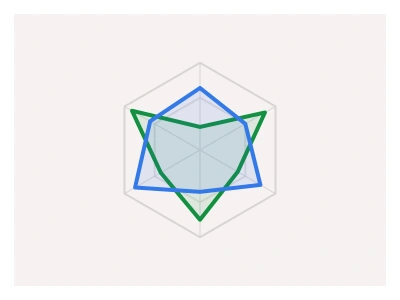
| ChartRadial | 7 | Segment x7, x6, x5, x4, x3, x2, x1 |
| ChartAxis | 6 | Items x12, x7, x4Y Axis 2, 1 |
| MapWorld | 2 | Type Dots, Shapes |
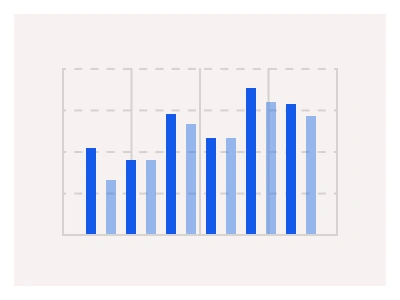
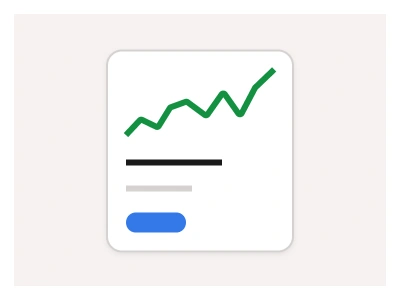
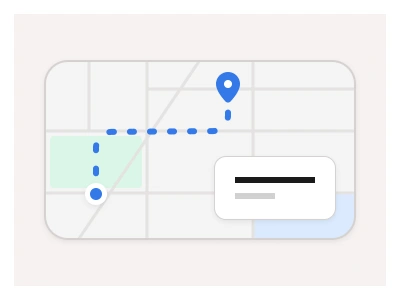
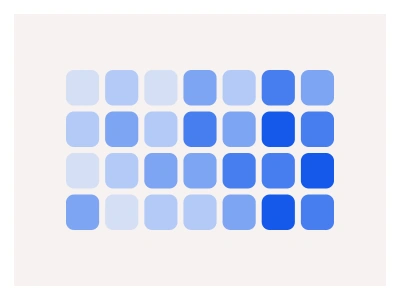
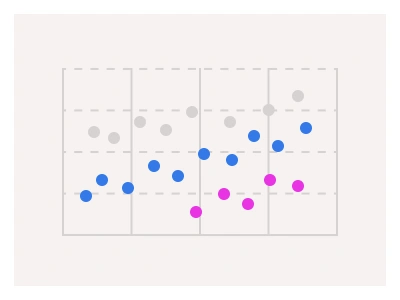
The charts builder is fourteen sets: curved and sharp line charts with 10 to 45 points in Uptrends, Sideways and Downtrends, pie and donut charts with 2 to 8 segments in full and semi-circular types, a 12-level Heatmap cell, radial and bar charts, a ChartAxis, a ChartLegend of up to 7 items, a ChartTable, trend captions and a world map in dots or shapes.
Chart AI Prompt
Paste this into Claude, ChatGPT, or Figma Make:
Build a chart builder in Figma as a family of component sets that snap together. Lines: a curved and a sharp line chart with a Points property of 10, 15, 30 or 45 and a Trend of Uptrends, Sideways or Downtrends, each with a gradient fill under the line. Pie and donut: Default and Semi Circular types with 2 to 8 segments in the chart palette, the donut carrying a centre value. Bars: vertical bars labelled Top or Bottom and horizontal bars labelled Left or Right. Radial: a ring chart with 1 to 7 concentric segments. Heatmap: one cell with twelve levels from Null and 0% to 100% in tint steps. Axis: a ChartAxis with 4, 7 or 12 X labels and one or two Y axes. Legend: a ChartLegend row of 1 to 7 coloured dots with labels in three sizes. ChartValues: a value stack in horizontal or vertical layout with up or down trend. TrendCaption: a delta pill in Uptrends, Downtrends, Icon or Text types. ChartTable: a compact data table in two sizes. MapWorld: a world map in Dots or Shapes. Compose a dashboard card from axis, line, legend and caption to prove they align on one grid.
Figma Chart
Chart
figma charts
charts examples
charts design
Interactive component
Premium Figma UI Kit & design resources
Explore high-quality Figma components, templates, and UI elements.