Figma Analytics
Figma Analytics
Preview
Figma Analytics
Figma Analytics Template
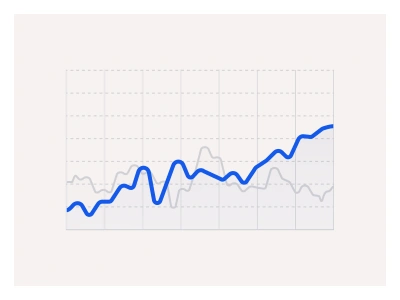
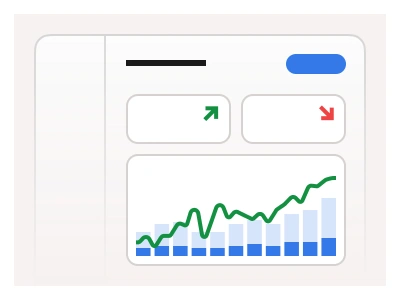
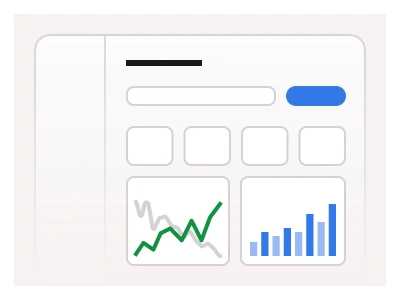
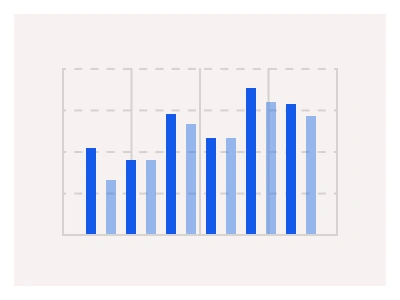
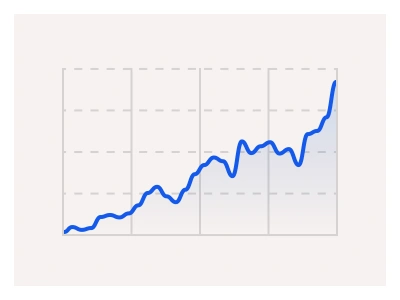
The analytics dashboard includes metrics and reports on account financial performance. The dashboard design features monetary insights for accounts, enabling users to make informed financial decisions.
The analytics are composed of Widgets, Tables, and Card components to create a responsive Figma layout.
The analytics template is a financial performance dashboard — monetary KPI stat cards and report blocks composed from the kit's chart and table components in a responsive layout.
Analytics AI Prompt
Paste this into Claude, ChatGPT, or Figma Make:
Build a financial analytics dashboard in Figma for desktop, tablet and mobile. Top: a page title with a date-range picker and an Export button on the right. First row: four stat cards — Revenue, Expenses, Net profit, Transactions — each with a label, a large value, a small percentage change with an up or down arrow in green or red, and a tiny sparkline. Second row: a wide line chart of revenue versus expenses over twelve months with a legend and hover tooltip, beside a donut chart of spending by category with a centre total. Third row: a bar chart comparing monthly profit, and a table of recent transactions with columns for date, description, category, status badge and amount, with pagination at the bottom. Add a left sidebar with Dashboard, Reports, Accounts, Budgets and Settings links. On tablet make the stat cards two per row and stack charts; on mobile stack everything in one column and turn the table into a list of cards. Keep spacing on an 8px grid and bind colours to variables.
Figma Analytics
Figma Analytics
analytics dashboard
data analytics dashboard
analytics component
Interactive component
Premium Figma UI Kit & design resources
Explore high-quality Figma components, templates, and UI elements.